Portfolio Risk Scoring
Traditional financial risk models are ill-suited to fully characterize the distinctive behaviour of cryptocurrency markets. The confluence of extreme price volatility, heavy-tailed and non-normal return distributions, and rapidly evolving correlation structures necessitates a fundamentally different analytical methodology.
On this page we will introduce a suite of advanced risk assessment metrics and strategic diversification frameworks specifically tailored for sophisticated cryptocurrency investors and institutional portfolios. By integrating quantitative rigor with market-specific insights, These tools are crafted to help you make informed decisions, optimize risk-adjusted performance, and build a resilient portfolio capable of navigating the complexities of crypto-assets market.
Extreme Volatility Characteristics
Cryptocurrency returns demonstrate significant skewness and excess kurtosis, with fat tails that traditional Gaussian models cannot accurately capture. This non-Gaussian behavior has several important implications:
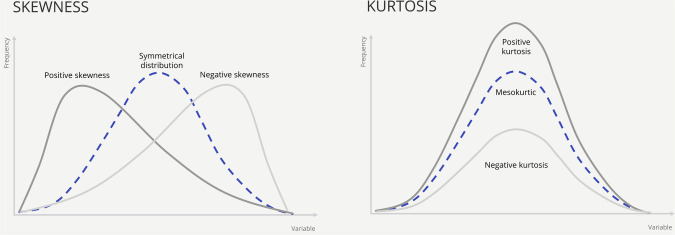
Skewness: While cryptocurrencies have experienced periods of exponential growth leading to significant positive returns, this doesn't consistently mean large positive returns occur more frequently than large negative returns of the same magnitude.
In fact, crypto markets are also notorious for "flash crashes" and prolonged bear markets where large negative returns are very common. Many returns distribution show fat tails (leptokurtosis) but not consistently positive skewness, and often, even negative skewness during bear markets.
Excess Kurtosis (Leptokurtic Distribution): The distribution has a higher, sharper peak and fatter tails than the normal (Gaussian) distribution.
Standard Deviation Limitations
The fat tails characteristic of crypto returns indicate that extreme events occur far more frequently than a standard normal distribution anticipates. This leads Gaussian models to drastically underestimate true downside risk. Consequently, they often understate tail risk by 30-40% in crypto backtests, missing the volatility clustering common in digital asset markets.
Value-at-Risk Challenges
Historical VaR models underestimate tail risk for illiquid assets by 50% or more during periods of market stress, while Conditional VaR requires dynamic weighting schemes. The fat tails mean that extreme events, both large gains and large losses, occur much more frequently than predicted by the normal distribution.
Dynamic Correlation Structures
Cryptocurrency correlations exhibit regime-switching behavior, meaning that the relationships between assets fluctuate significantly across different market conditions. For instance, a pair of crypto-assets may show a low correlation (0.3) during calm periods but spike to a very high correlation (0.95) during market stress.
Misleading risk-adjusted performance:
Challenges for Dynamic Portfolio Optimization
- Rapidly shifting diversification benefits: Portfolio allocations optimized based on historical correlations may fail during sudden regime changes, leading to unexpected drawdowns.
- Non-linear interactions: Assets may become highly correlated only during downturns, reducing the effectiveness of standard mean-variance optimization.
- Need for adaptive models: Effective crypto portfolio management requires dynamic risk models that incorporate time-varying correlations, stress testing, and tail-risk scenarios to adjust allocations proactively.
Non-Linear Dependence Patterns
Advanced copula analysis reveals asymmetric dependence structures in crypto markets:
- Downside correlations increase 2-3x during market drawdowns
- Upside movements demonstrate mean-reverting characteristics
- Liquidity shocks create temporary correlation breakdowns
Implications of Non-Linear Dependence
Non-linear and asymmetric correlations mean that crypto assets do not always move in predictable ways relative to one another. During market stress, assets that historically appeared uncorrelated can suddenly move together, amplifying portfolio risk.
Understanding these patterns is critical for effective risk management: simple covariance matrices may underestimate joint downside risk, while advanced copula models allow investors to anticipate extreme co-movements and allocate capital more strategically.
By integrating these insights into portfolio construction, investors can enhance resilience, mitigate tail risks, and avoid overexposure to correlated drawdowns.
Data Quality Challenges: The Foundation of a Resilient Portfolio
High-quality data is essential for building a resilient portfolio. Gaps in price history, liquidity mismatches, and volatility overstatements can distort risk assessments, underestimate correlations, and introduce biases in asset allocation. This section highlights key data challenges and their direct impact on portfolio robustness. Critically, missing data points often lead to flawed ratio calculations, ultimately obscuring the true risk exposure of the portfolio.
<20%
Tokens with 3+ years of continuous price data
$12M
Average daily liquidity for top 100 crypto assets
+40%
Volatility overstatement for illiquid assets
Data Continuity Issues
Over 60% of tokens outside the top 200 exhibit price data gaps exceeding 10% of trading days, creating artificial return-smoothing effects.
Liquidity Mismatch Risks
Assets with daily trading volume below $5M demonstrate 2.5x higher volatility during stress periods compared to their liquid peers.
AI-Powered Optimisation with Proprietary Algorithms
“That which is static and repetitive is boring. That which is dynamic and random is confusing. In between lies art.”
We leverage cutting-edge Artificial Intelligence, decades-refined proprietary algorithms, and strategically selected financial ratios to determine the optimal portfolio allocation hence minimizing risks. Our methodology ensures resilience, precision, and adaptability in volatile markets.
Here’s how we achieve it:
- Predictive AI Models: Our algorithms analyse thousands of macroeconomic variables, market sentiment indicators, and on-chain data to uncover hidden arbitrage opportunities and correlation regimes that traditional models miss.
- Adaptive Financial Ratios: We dynamically optimise a unified function to maximise the Calmar and Sortino ratios while simultaneously minimising Maximum Drawdown (MDD), ensuring optimal risk-adjusted returns tailored to real-time market conditions.
- Decades of Financial Expertise: Our algorithms are built on deep institutional knowledge, refined through years of experience in quantitative finance and AI-driven asset management.
- Crypto assets scoring: Consequently, we had no alternative but to develop an entirely new mathematical model specifically designed to evaluate and rate crypto assets.
Mastery in Data Cleaning and Normalisation
Poor data quality distorts risk assessments and undermines portfolio performance. We excel in:
- Data Continuity: Filling gaps in price histories using advanced interpolation techniques. In the interim, we are assessing our new Generative Adversarial Network (GAN), a generative AI model designed to produce synthetic data, thereby ensuring continuous and uninterrupted time-series analysis.
- Liquidity Adjustments: Normalising volatility and return metrics for illiquid assets, correcting overstated risk profiles that skew optimisation.
- Outlier Treatment: Identifying and adjusting for anomalies, such as exchange-specific price deviations or flash crashes, to prevent bias in backtesting.
- Cross-Asset Harmonisation: Aligning disparate data sources (e.g., DeFi vs. CeFi) into a unified framework, enabling apples-to-apples comparisons across asset classes.
Challenges our optimization method successfully resolves.
Classical asset allocation methodologies, such as mean-variance optimization and the Capital Asset Pricing Model (CAPM), face notable limitations when applied to cryptocurrencies.
- These models presuppose stable statistical properties, namely, normally distributed returns, low kurtosis, and time-invariant correlations, that are rarely observed in crypto markets.
- The extreme volatility, non-normal return distributions, and unstable correlations typical of crypto assets undermine the statistical assumptions these models rely on.
- Moreover, the fragmented, continuously operating, and sentiment-driven nature of crypto markets introduces additional noise and inefficiencies.
Redefining Risk Metrics: You Won’t Get a Second Chance
In the high-stakes world of cryptocurrency investing, the astute choice of metrics is the cornerstone of portfolio risk scoring, ensuring that downside exposure is measured accurately and resilience is built into every allocation decision. Traditional risk measures like VaR or CVaR are ill-suited for crypto assets, as their assumptions overlook the extreme tail risks and erratic volatility inherent in these markets. In contrast, Sortino ratio, Calmar ratio, and maximum drawdown provide a sharper, more practical view of downside risk, focusing on volatility and drawdown severity. Even with noisy or incomplete data, these metrics remain robust, enabling investors to make informed allocation decisions and confidently navigate crypto market volatility.
"Sortino Ratio Advantages"
Focuses exclusively on downside volatility, revealing 20-30% higher risk-adjusted returns than Sharpe ratio for crypto portfolios.
Max Drawdown Analysis
BTC's 84% MDD in 2018 versus S&P 500's 50% in 2008 highlights crypto's unique risk profile and recovery patterns.
"Calmar Ratio Insights"
Ratios > 1.0 indicate robust recovery potential. Top quartile crypto funds maintain a minimum of: 1.5 Calmar through market cycles.
How it works?

Unlock the Future: Discover the New Standard in Crypto Risk
Sophisticated crypto investors require dynamic risk frameworks that account for the asset class's unique characteristics. By integrating advanced metrics with strategic diversification, portfolios can achieve institutional-grade resilience across all market conditions.